Up to now, this tutorial has been quite generic. This part is for particle physics students.
Some
helpful chap has wrapped up the entirety of ROOT into a python module.
Since python syntax is more natural than C++ and the python interpreter
does not suffer from as many bugs and problems with non-standard syntax
as the 'CINT' interpreter, I recommend using pyROOT instead of CINT
when you are starting any program from scratch. People may suggest that
python is slower than C++. It is, but that statement applies to
compiled C++ not CINT, for the most part it doesn't matter and also you
need to know C++ well to make it very fast. At the end of the day, any
really slow parts of your code can be re-written in C(++) if absolutely
necessary. Remember two generalizations about C++ and general execution
times.
1) The average C++ software engineer writes 6 lines of useful, fully tested and debugged code per day.
2) 80% of the CPU time will be spent on 20% of your code even after you have optimised the slow parts.
Lets
begin by setting up root. To use pyROOT, the C++ libraries must be on
your PYTHONPATH. This is set up automatically by the most recent Oxford
set-up scripts.
pplxint8.physics.ox.ac.uk%> module load root
pplxint8.physics.ox.ac.uk%> echo $PYTHONPATH
Expand....
In the case of pyROOT a deliberate decision was made by the developers
not to import all of the symbol names when import is run. Only after
the symbol is first used is it available to the interpreter (e.g. via
tab-complete or help()).
Lets now import the ROOT module into root and use it to draw a simple histogram.
In [1]: import ROOT
In [2]: ROOT.gROOT.Reset()
In [3]: dir(ROOT)
Out[3]:
['PyConfig',
'__doc__',
'__file__',
'__name__',
'gROOT',
'keeppolling',
'module']
In [4]: x=TH1F()
In [5]: dir(ROOT)
Out[5]:
['AddressOf',
'MakeNullPointer',
'PyConfig',
'PyGUIThread',
'SetMemoryPolicy',
'SetOwnership',
'SetSignalPolicy',
'TH1F',
'Template',
'__doc__',
'__file__',
'__name__',
'gInterpreter',
'gROOT',
'gSystem',
'kMemoryHeuristics',
'kMemoryStrict',
'kSignalFast',
'kSignalSafe',
'keeppolling',
'module',
'std']
Expand....
Debugging tip: If you are changing the version of
python (sometimes implicit when altering your root version) you may want
to eithe re-create your ipython profile (rm -r ~/.ipython; ipython profile create default) or run ROOT.gROOT.Reset() to allow the graphics to be displayed.
To use root in the ipython interpreter and create, fill and draw a basic histogram:
In [1]: import ROOT, time
In [1]: ROOT.gROOT.Reset()
In [2]: hist=ROOT.TH1F("theName","theTitle;xlabel;ylab",100,0,100)
In [3]: hist.Fill(50)
Out[3]: 51
In [4]: hist.Fill(50)
Out[4]: 51
In [5]: hist.Fill(55)
Out[5]: 56
In [6]: hist.Fill(45)
Out[6]: 46
In [7]: hist.Fill(47)
Out[7]: 48
In [8]: hist.Fill(52)
Out[8]: 53
In [9]: hist.Fill(52)
Out[9]: 53
In [10]: hist.Draw()
Info in <TCanvas::MakeDefCanvas>: created default TCanvas with name c1
In [11]: save 'rootHist' 1-10
In [12]: ctrl+D
pplxint9.physics.ox.ac.uk%> echo '#Sleep for 10 secs as a way to view the histogram before the program exits'>> rootHist.py
pplxint9.physics.ox.ac.uk%> echo 'time.sleep(10)'>> rootHist.py
pplxint9.physics.ox.ac.uk%> python rootHist.py
Expand....
You can view the contents of rootHist.py using an editor like "emacs".
To fill an ntuple/Tree
import ROOT
ROOT.gROOT.Reset()
# create a TNtuple
ntuple = ROOT.TNtuple("ntuple","ntuple","x:y:signal")
#store a reference to a heavily used class member function for efficiency
ntupleFill = ntuple.Fill
# generate 'signal' and 'background' distributions
for i in range(10000):
# throw a signal event centred at (1,1)
ntupleFill(ROOT.gRandom.Gaus(1,1), # x
ROOT.gRandom.Gaus(1,1), # y
1) # signal
# throw a background event centred at (-1,-1)
ntupleFill(ROOT.gRandom.Gaus(-1,1), # x
ROOT.gRandom.Gaus(-1,1), # y
0) # background
ntuple.Draw("y")
Expand....
Instead of launching the script from the Linux command line, it is
possible to run the script from within the "ipython" interpreter and
keep all your variables so that you can continue to work.
shell> ipython
%run root-hist.py
Expand....
Also, a feature of the root module means that the ntuple and the new
canvas appears in the ROOT name-space for you to continue using it in
your program too.
ROOT.c1
ROOT.ntuple
hist=ROOT.ntuple.GetHistogram()
hist.GetNbinsX()
Expand....
You can also find your objects again using the TBrowser.
t=ROOT.TBrowser()
Expand....
The GUI that pops up has a number of pseudo-directories to look in.
Open the one that says 'root' in the left pane and navigate to ROOT
Memory-->ntuple. You can double click on your histograms to draw
them from here.
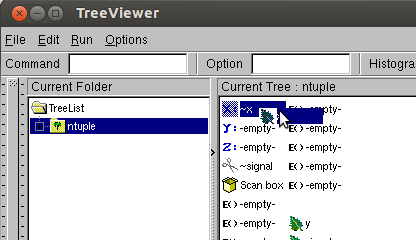
By right-clicking on the name of your ntuple (in
this case just 'ntuple') and navigating to 'Start Viewer', you can drag
and drop the variables to draw as a histogram or apply as a cut. Drag
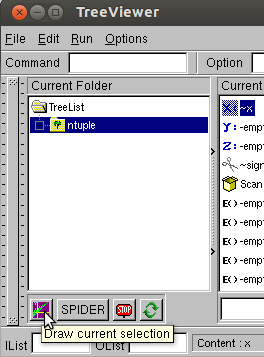
signal into the box marked with scissors and x onto the 'x' box. Click
the purple graph icon to Draw. You may have to create the canvas first.
You can do that from the new TBrowser - See the "Command" box in
figure 1.
 Figure 1: Editing a cut and creating a canvas from the TBrowser
 Figure 2: Making a new canvas from the Browser

Figure 3: The draw current selection box
Filling an ntuple
The attached source code contains a workable demonstration of working with ROOT ntuples, covering:
Now work through demo 5 in the attached source code
Garbage collection (specific to ROOT but not specific to pyROOT)
Normally,
garbage collection is classed as an advanced concept, however in my
experience most of the annoyance of ROOT in general was to do with
seemingly random crashes. Most of these were actually due to the object
I was using disappearing at various point in the program. This was due
to misunderstanding ROOT's object ownership model, which functions as a
poor-mans garbage collection. This happens outside of python.
Root
objects are not persistent. They are owned by the directory they
"exist" within. In this case the histogram is actually owned by the
canvas (which is itself a directory in ROOT), but the ntuple only
contains a reference to it. TDirectory and TPad classes and derived
classes count as directories in this model.
htemp=ROOT.ntuple.GetHistogram()
htemp2=ROOT.c1.GetListOfPrimitives()[1]
if htemp==htemp2:
print 'We have two references to the same object'
#Draw the histogram, all is fine
htemp.Draw()
##At this point we elect to close the canvas. The canvas disappears and is deleted.
##The canvas owns the histogram drawn within, which also gets deleted.
htemp.Draw()
##Causes an error, How did that happen?
Expand....
One way to rescue the situation, if you want the histogram to outlive the canvas you can make a copy:
....
hpersist=ROOT.c1.GetListOfPrimitives()[1].Clone()
###Now close the canvas
hpersist->Draw()
###Draws a nice histogram
Expand....
or you can remove the histogram from the pad before you close it
htemp=ROOT.ntuple.GetHistogram()
##Remove the histogram from the list of objects owned by c1
##Try moving the histogram inside canvas around (to force a re-draw). It disappears.
ROOT.c1.GetListOfPrimitives().Remove(htemp)
###Now close the canvas
htemp.Draw()
##Don't forget to remove the histogram from the list of canvas primitives before closing the next canvas!
print htemp
Expand....
Chapter 8 of the ROOT manual details more on object ownership.
14) Additional Resources:
Official python tutorialGoogle python tutorial complete with videos. Videos cover the simple topics in quite a lot of depth.pyroot at cern


