Conexiones de Medidores de Energía Eléctrica trifilar con neutra directa
https://www.slideshare.net/luisnuez139/instalaciones-elctricas-internas-oficial
Sensor Logging, Graphing, and More
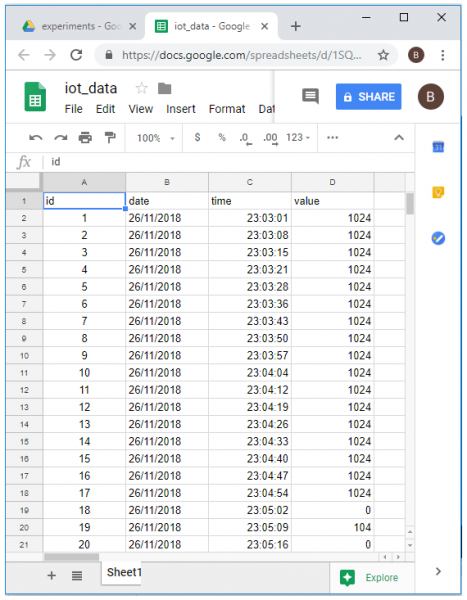
While there are many data logging and visualization services designed specifically for the IoT, Google Sheets is often a great starting point as it’s familiar, free, and reliable with lots of functionality and built-in integrations with many other Google applications and services. Looking to log temperature data for a storage facility, view live updated graphs of engine performance, or remotely operate a water management system? We’ve seen our customers use Google Sheets for these ends and many more.

Every week we see customers from all sorts of industries build their IoT applications with Temboo, and the Google Sheets AppendValues Choreo is one of the first places they start. While many of our customers move on to other data logging services in their final applications, we see many others who realize Google Sheets provides all the functionality they need.

You might be surprised by some of the things Sheets can do:
- Logging sensor data to Google Sheets is simple and robust.
With Temboo you can program a straightforward sensor logging application in under ten minutes. Try it on the Samsung ARTIK, Arduino, Arduino Yún, or your TI CC3200. - Data from APIs can be logged instead of or alongside sensor data.
For example, FitBit activity data could be logged together with environmental sensor data from a properly configured Arduino Yún. - Clean-looking data visualization is built-in.
Just select the range of data you want to graph and select Insert > Chart to get Sheets’ recommendations on the best visualizations for your dataset.

- Embed your graphed data on the web.
Google Charts can be embedded on any webpage and have native Sheets integration. - Manipulate and analyze your data with functions.
Collecting data is only the beginning of the story. Powerful Sheets functions allow you to perform complex calculations to all of your incoming data. - The Sheets mobile app is great—and free.
You can check in on your data or show off your application to colleagues anywhere your Android or iOS device goes. - Write Custom Sheets functions and Google Apps integrations with Apps Script.
Google Apps Script is based on JavaScript and lives in the cloud. Many Google Apps add-ons built with Google Apps Script are already available in the G Suite Marketplace. - Conditional formatting can communicate your data at a glance.
Charts aren’t the only way to visually communicate data. Setting conditional formatting rules about what the incoming data means to you can boost legibility. - Google BigQuery is integrated with Google Drive.
That means you can save your database query results to Google Sheets and query Google Sheets from BigQuery, even as you edit them. Learn more about the Google Drive and BigQuery integration here. Work with your BigQuery data from your connected devices with help from our BigQuery Choreos.
The possible applications you could create are limitless in light of the flexibility and native integration available within Google Sheets and across all of Google Apps and Google Cloud. Our list above is only the tip of the iceberg.


