jueves, 5 de diciembre de 2019

Tutorial on using tail, a UNIX and Linux command for outputting the last part of files.

Tutorial on using tail, a UNIX and Linux command for outputting the last part of files


https://shapeshed.com/unix-tail/

Last updated 

Linux and Unix tail command tutorial with examples

Tutorial on using tail, a UNIX and Linux command for outputting the last part of files. Examples of outputting the last ten lines of a file, limiting the number of lines, limiting the number of bytes, showing multiple files, watching a file for changes and using pipes.


Estimated reading time: 3 minutes

Table of contents

Terminal showing tail man page

What is the tail command?

The tail command is a command-line utility for outputting the last part of files given to it via standard input. It writes results to standard output. By default tail returns the last ten lines of each file that it is given. It may also be used to follow a file in real-time and watch as new lines are written to it.

How to view the last ten lines of a file

To view the last ten lines of a file pass the name of a file to the tail command. The last ten lines of the file will be printed to standard output.
tail /usr/share/dict/words
zygote's
zygotes
zygotic
zymurgy
zymurgy's
Zyrtec
Zyrtec's
Zyuganov
Zyuganov's
Zzz

How to limit the number of lines to show

To set the number of lines to show with tail pass the -n option followed by the number of lines to show.
tail -n 1 /usr/share/dict/words
Zzz 

How to limit the number of bytes to show

To limit the number of bytes shown with tail pass the -c option. Instead of limiting by number of lines this will limit by the number of bytes passed to the -c option. In the following example the output is limited to 16 bytes.
tail -c 24 /usr/share/dict/words
Zyuganov
Zyuganov's
Zzz

How to show multiple files

To show the last ten lines of multiple files pass more than one filename to the tail command. This will output the last ten lines of each file to standard output with a header indicating which file is being shown.
tail /usr/share/dict/words /usr/share/dict/french
==> /usr/share/dict/words <==
zygote's
zygotes
zygotic
zymurgy
zymurgy's
Zyrtec
Zyrtec's
Zyuganov
Zyuganov's
Zzz

==> /usr/share/dict/french <==
zoos
zouave
zouaves
zozoter
zéro
zéros
zyeuter
zézaiement
zézaiements
zézayer
To suppress the header line pass the -q option. This can be useful to combine files.
tail -q /usr/share/dict/words /usr/share/dict/french
zygote's
zygotes
zygotic
zymurgy
zymurgy's
Zyrtec
Zyrtec's
Zyuganov
Zyuganov's
Zzz
zoos
zouave
zouaves
zozoter
zéro
zéros
zyeuter
zézaiement
zézaiements
zézayer

How to watch a file for changes

To watch a file for changes with the tail command pass the -f option. This will show the last ten lines of a file and will update when new lines are added. This is commonly used to watch log files in real-time. As new lines are written to the log the console will update will new lines.
tail -f /var/log/nginx/access.log
173.169.79.32 - - [03/Oct/2016:21:20:09 +0100] "GET / HTTP/1.1" 200 2213 "-" "Mozilla/5.0 (Macintosh; Intel Mac OS X 10_11_6) AppleWebKit/601.7.7 (KHTML, like Gecko)"
...
Newer versions of tail also support watching multiple files. As the file updates a header will show which line the update is from.
tail -f /var/log/nginx/access.log /var/log/nginx/access.log

==> /var/log/nginx/access.log <==
173.169.79.32 - - [03/Oct/2016:21:23:09 +0100] "GET /apple-touch-icon-precomposed.png HTTP/1.1" 404 162 "-" "Safari/11601.7.7 CFNetwork/760.6.3 Darwin/15.6.0 (x86_64)"

==> /var/log/nginx/error.log <==
2016/10/03 21:23:53 [error] 30632#30632: *1737 access forbidden by rule, client: 216.137.60.86, server: shapeshed.com, request: "GET /wp-login.php HTTP/1.1", host: "shapeshed.com"

How to use tail with pipes

The tail command can be piped to from other commands. In the following example the output of the ls command is piped to tail to only show the five files or folders modified the longest time ago.
ls -t /etc | tail -n 5
login.defs
request-key.conf
libao.conf
mime.types
pcmcia

How To Install Visual Basic 6.0 Professional In Windows 10, 8, 7 | Programming Guru


How To Install Visual Basic 6.0 Professional In Windows 10, 8, 7 |  Programming Guru

https://www.youtube.com/watch?v=CdUmSVAgY08


Visual Basic 6 SP6 Working in Windows 10 64-bit


A quick guide on how to install Visual Basic 6.0 with Service Pack 6 on Windows 10 64-bit. It took us weeks to get it working properly, so hopefully this will save people some time. Until MS inevitably breaks this procedure with an update, anyway. VB6 Install Wizard - http://nuke.vbcorner.net/ Service Pack 6 - https://www.microsoft.com/en-us/downl... The command you need to type to register DAO350.DLL is : regsvr32 "c:\Program Files (x86)\Common Files\Microsoft Shared\DAO\DAO350.DLL" Paste the entire thing including quotes into the 32-bit Admin command prompt. Common errors fixed by this tutorial (to help people googling) - 01:39 - "You must first run the installation wizard" is cured by editing the Registry 02:15 - "Visual Basic 6.0 Professional Setup was not completed successfully" is fixed by rerunning the installer with no options selected 03:01 - "Can't find file DAO350.dll" is fixed by manually registering it 03:23 - "Unexpected Error; quitting" is fixed by copying the DLLs from the VBA folder in "common files\microsoft shared" to the main VB6 program folder 03:43 - SP6 fixes the "Object Library not registered" error when attempting to add certain older OCX files, for example RICHTX32.OCX (Rich Textbox Control) and MSCOMCTL.OCX (Windows Common Controls) 03:53 - Running a repair install fixes the "Visual Studio 6.0 Service Pack 6 Setup was not completed successfully." error you get immediately after clicking the license agreement for SP6 install 04:26 - Adding the installdir to the 64bit registry fixes the error where you install SP6 (version 9782 / 6.0.9782) but it stays at the old version (8176 / 6.0.8169)

IoT con Drive de Google - Reasons to Use Google Sheets for IoT Sensor Data Graphs

IoT con Drive de Google - Reasons to Use Google Sheets for IoT Sensor Data Graphs

Google Drive IoT - причины использования таблиц Google для графиков данных датчика Интернета вещей


Reasons to Use Google Sheets for IoT Sensor Data Graphs


Sensor Logging, Graphing, and More

While there are many data logging and visualization services designed specifically for the IoT, Google Sheets is often a great starting point as it’s familiar, free, and reliable with lots of functionality and built-in integrations with many other Google applications and services. Looking to log temperature data for a storage facility, view live updated graphs of engine performance, or remotely operate a water management system? We’ve seen our customers use Google Sheets for these ends and many more.
remotely-monitoring-factory-operations-data
Every week we see customers from all sorts of industries build their IoT applications with Temboo, and the Google Sheets AppendValues Choreo  is one of the first places they start. While many of our customers move on to other data logging services in their final applications, we see many others who realize Google Sheets provides all the functionality they need.
Generating code to log data to a Google Sheet on Temboo.com
You might be surprised by some of the things Sheets can do:
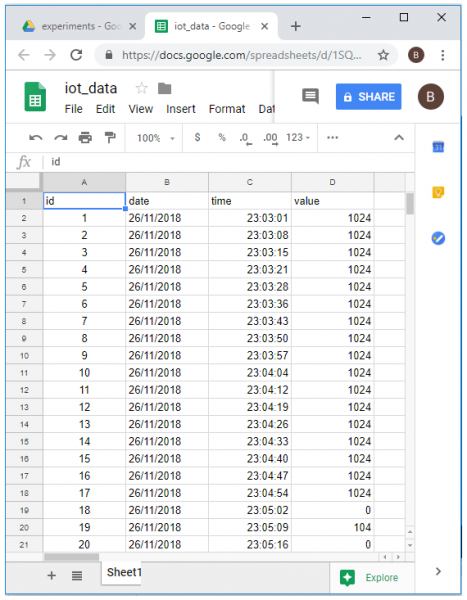
  • Logging sensor data to Google Sheets is simple and robust.
    With Temboo you can program a straightforward sensor logging application in under ten minutes. Try it on the Samsung ARTIKArduinoArduino Yún, or your TI CC3200.
  • Data from APIs can be logged instead of or alongside sensor data.
    For example, FitBit activity data could be logged together with environmental sensor data from a properly configured Arduino Yún.
  • Clean-looking data visualization is built-in.
    Just select the range of data you want to graph and select Insert > Chart to get Sheets’ recommendations on the best visualizations for your dataset.
artboard-21
  • Embed your graphed data on the web.
    Google Charts can be embedded on any webpage and have native Sheets integration.
  • Manipulate and analyze your data with functions.
    Collecting data is only the beginning of the story. Powerful Sheets functions allow you to perform complex calculations to all of your incoming data.
  • The Sheets mobile app is great—and free.
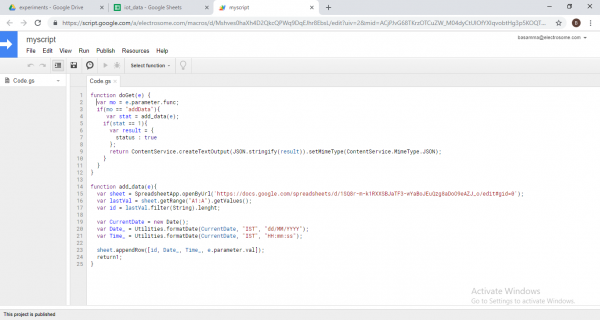
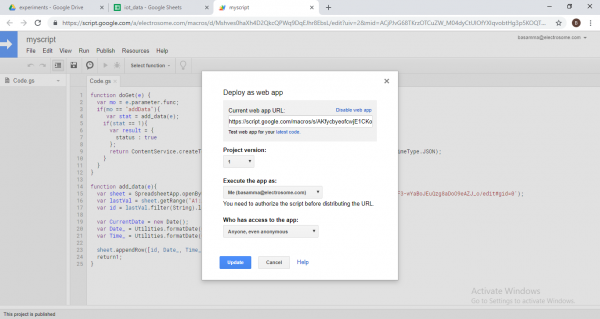
    You can check in on your data or show off your application to colleagues anywhere your Android or iOS device goes.
  • Write Custom Sheets functions and Google Apps integrations with Apps Script.
    Google Apps Script is based on JavaScript and lives in the cloud. Many Google Apps add-ons built with Google Apps Script are already available in the G Suite Marketplace.
  • Conditional formatting can communicate your data at a glance.
    Charts aren’t the only way to visually communicate data. Setting conditional formatting rules about what the incoming data means to you can boost legibility.
  • Google BigQuery is integrated with Google Drive.
    That means you can save your database query results to Google Sheets and query Google Sheets from BigQuery, even as you edit them. Learn more about the Google Drive and BigQuery integration here. Work with your BigQuery data from your connected devices with help from our BigQuery Choreos.
The possible applications you could create are limitless in light of the flexibility and native integration available within Google Sheets and across all of Google Apps and Google Cloud. Our list above is only the tip of the iceberg.

IoT con Drive de Google - Google Sheets for IOT

IoT con Drive de Google - Google Sheets for IOT
IoT с Google Drive - Google Sheets для IOT


https://www.instructables.com/id/Google-Sheets-for-IOT/

You are here because you know what this is all about. An IOT project often requires that I empty my pockets, learn a new database and micro-controller etc, and it is rarely that everything works in the first try, or the second, if you are persistent enough it will surely work.
Now that we are on the same page I am sharing with you this little yet useful hack that saved me a few bucks on most of my IOT projects, and the best part is it is free, cross platform, online and just works.

One of the most important things that any IOT project requires is a database to store the values, results and do some computation on them. In this brief instructable you will learn how to use google sheets to replace your typical database.
"Yes, you can use this same trick for any other project such as a mobile application, website, robotics, etc."

Teacher Notes

Teachers! Did you use this instructable in your classroom?
Add a Teacher Note to share how you incorporated it into your lesson.

Step 1: Getting Ready

Picture of Getting Ready
The only thing you need to get started is a google account. That is all that you require and it would be making fun of you to show you how to create a google account. So the next logical thing to do is, as you guessed it to create a new google sheet.
So, head on to Google Sheets and create a new sheet, and name it whatever you want.
The first row will be important. It serves as the titles to the data information we will input.
For example if you want column B to have data of dates, then in the first row of column B you will have the word date. In the following rows you will input the various dates you need.
The column titles should only be one word, no uppercase. If you need to use multiple words for the column title then insert a hyphen between the words. You can view the image for reference.

Step 2: Connecting Through Code

Picture of Connecting Through Code
Now that your Google Sheet is setup, you’ll need to link the spreadsheet to your IOT deivce. To do that we’ll use an google apps script. I recommend this because it’s free and easy to setup.
You’ll need to download nothing . It can be found here.
There are detailed instructions to setting it up , but I’ll give a brief walkthrough.
Go to Tools>ScriptEditor in your created google sheet.
Copy and Paste the below code into a script file :
var sheet_key = "KEY OF YOUR SHEET";
var sheet_name = "NAME OF YOUR SHEET";
function doGet(e){
var ss = SpreadsheetApp.openById(sheet_key);
var sheet = ss.getSheetByName(sheet_name);
var temp = Number(e.parameter.temp);
var date = Number(e.parameter.date);
sheet.appendRow([temp,date]);
}
Substitute sheet_key with your Google spreadsheet key. To find your spreadsheet key, go back to your Google Sheet.
The sheet_key is in the URL and is after “https://docs.google.com/spreadsheets/d/“ and before the last “/”. The key will be letters and numbers and possibly have hyphens or underscores.
The sheet_name is the name of your workspace, in my case it is "One".
Save the script with any relevant name.

Step 3: Publishing Your Script

Picture of Publishing Your Script
When you run this on your device, it will not work that is because you need to publish your script.
Go back to your Google Script and go to Publish >Deploy as web app You will get a dialog menu.
It will ask you to authorise the code execution on your behalf, simply click Allow. You only need to do this once.
Make sure you have entire document selected in the drop down option. You can choose to automatically publish changes by checking the feature on the bottom. If you don’t do this, you will have to publish the spreadsheet every time you make a change.
By using AppsScript you can connect your Google Sheet to your IOT device. Using Google Sheets as your database allows you to avoid learning a new database platform. With that said, this is an easy and free way to get a database up and running relative to other options.

Step 4: Setting Up URL

Picture of Setting Up URL
So far we have set up your database now it is time to put some values into it, for that do the following.
Copy the link to your deployed web app, then replace the "dev" or "exex" with "exec?temp=30&date=1708"
It is obvious that you can modify the value of temp and date using the code in your IOT platfrom.
Thus your URL wll look like :-
''https://script.google.com/macros/s/SCRIPT_ID/exec?temp=1234&date=1234"

IoT con Drive de Google - Updating Sensor Data to Google Spreadsheet using ESP8266 – IoT Project

IoT con Drive de Google - Updating Sensor Data to Google Spreadsheet using ESP8266 – IoT Project

Google Drive IoT - обновление данных датчика в электронной таблице Google с использованием ESP8266 - IoT Project


 Updating Sensor Data to Google Spreadsheet using ESP8266 – IoT Project
https://electrosome.com/updating-sensor-data-google-spreadsheet-esp8266-iot-project/
In IoT applications, the monitored sensor data needs to be recorded. This data logging is important for data analytics. So in this tutorial, we will record the sensor captured data in a Google spreadsheet.

Components Required

  • ESP8266
  • 10KΩ Potentiometer
  • Breadboard
  • USB Cable
  • Connecting Wires

Hardware

Circuit Diagram

Updating Sensor Data to Google Spreadsheet using ESP8266 - Circuit Diagram
Updating Sensor Data to Google Spreadsheet using ESP8266 – Circuit Diagram

Software

Google Spreadsheet Creation

  • Login to your Gmail account and open Google Drive.
  • Create a new folder, name it and open the folder.
  • Inside the folder right click and click on Google Sheets.
  • Google sheet will be created inside the folder, Spreadsheet will open in new tab and name the spreadsheet according to your wish.
  • Specify the fields in spreadsheet tables like id, time, date and value.
  • Go to Tools, click on Script editor (in new tab Script editor will open).
    Updating Sensor Data to Google Spreadsheet using ESP8266 - Google Spreadsheet - Script editor
    Updating Sensor Data to Google Spreadsheet using ESP8266 – Google Spreadsheet – Script editor
  • Name the Script editor and write the below code in a script editor.
function doGet(e) 
{
  var mo = e.parameter.func;
  if(mo == "addData")
  {
    var stat = add_data(e);
    if(stat == 1)
    {
      var result = 
      {
        status : true
      };
      return ContentService.createTextOutput(JSON.stringify(result)).setMimeType(ContentService.MimeType.JSON);
    }
  }
}
function add_data(e)
{
  var sheet = SpreadsheetApp.openByUrl('https://docs.google.com/spreadsheets/d/182EnOR4vF5eVs4wGD-zOn7pKy_6BMpED8ApjIGh0C9Q/edit#gid=0');
  var lastVal = sheet.getRange("A1:A").getValues();
  var id = lastVal.filter(String).lenght;

  var CurrentDate = new Date();
  var Date_ = Utilities.formatDate(CurrentDate, "IST", "dd/MM/YYYY");
  var Time_ = Utilities.formatDate(CurrentDate, "IST", "HH:mm:ss");

  sheet.appendRow([id, Date_, Time_, e.parameter.val]);
  return 1;
}
  • Save the code
  • Go to publish and click on Deploy as web app.
  • Under Deploy as web app, enter Project version as my function and select anyone, even anonymous for the access to the app, click on Deploy icon
Updating Sensor Data to Google Spreadsheet using ESP8266 - Google Spreadsheet-Script editor - Deploy as web app
Updating Sensor Data to Google Spreadsheet using ESP8266 – Google Spreadsheet-Script editor – Deploy as web app
  • It will ask for permission so we have to give permission by click on “Give permission icon”
  • Select your google account and click on allow to give permission.
  • You will get web app URL, note down that URL and click ok.

Programming ESP8266

Arduino Code

#include <ESP8266WiFi.h>
#include <WiFiClientSecure.h>

const char *ssid = "SERVER NAME"; 
const char *password = "SERVER PASSWORD";  
const char* host = "script.google.com"; 
const char* fingerprint = "89 ff f4 0f 4d 98 09 ed e3 ef 95 f2 8a af af 22 89 08 ac 03";
String url;

void setup() 
{
  Serial.begin(115200);
  delay(100);
  Serial.println();
  Serial.println();
  Serial.print("Connecting to ");
  Serial.println(ssid);
  
  WiFi.begin(ssid, password); 
  while (WiFi.status() != WL_CONNECTED) 
  {
    delay(500);
    Serial.print(".");
  }
 
  Serial.println("");
  Serial.println("WiFi connected");  
  Serial.println("IP address: ");
  Serial.println(WiFi.localIP());
  Serial.print("Netmask: ");
  Serial.println(WiFi.subnetMask());
  Serial.print("Gateway: ");
  Serial.println(WiFi.gatewayIP());
}

void loop() 
{
  Serial.print("connecting to ");
  Serial.println(host);
 
  WiFiClientSecure client;

  const int httpPort = 443;
  if (!client.connect(host, httpPort)) 
  {
    Serial.println("connection failed");
    return;
  }

  float t = analogRead(A0);
  
  url = "/macros/s/AKfycbyvGjcryd7c5uNeX6dkleZhmjDKyTrs1L9Lf3kWlPhTZDn9JPrH/exec?func=addData&val="+ String(t);
  Serial.print("Requesting URL: ");
  Serial.println(url);
  
  client.print(String("GET ") + url + " HTTP/1.1\r\n" +
               "Host: " + host + "\r\n" + 
               "Connection: close\r\n\r\n");
  delay(500);
  String section="header";
  while(client.available())
  {
    String line = client.readStringUntil('\r');
    Serial.print(line);
  }
  Serial.println();
  Serial.println("closing connection");
  delay(6000);
}

Working

The ESP8266 reads the sensor data from analog pin A0 and updates that sensor captured data to Google Spreadsheet. So the monitored data will be recorded in a Google Spreadsheet we can use it further for data analytics.

Practical Implementation

Hardware

Updating Sensor Data to Google Spreadsheet using ESP8266 - Practical Implementation
Updating Sensor Data to Google Spreadsheet using ESP8266 – Practical Implementation

Google Spreadsheet

Updating Sensor Data to Google Spreadsheet using ESP8266 - Google Spreadsheet
Updating Sensor Data to Google Spreadsheet using ESP8266 – Google Spreadsheet

Video