Phase Locked Loop and FM Demodulation, Active Filters.
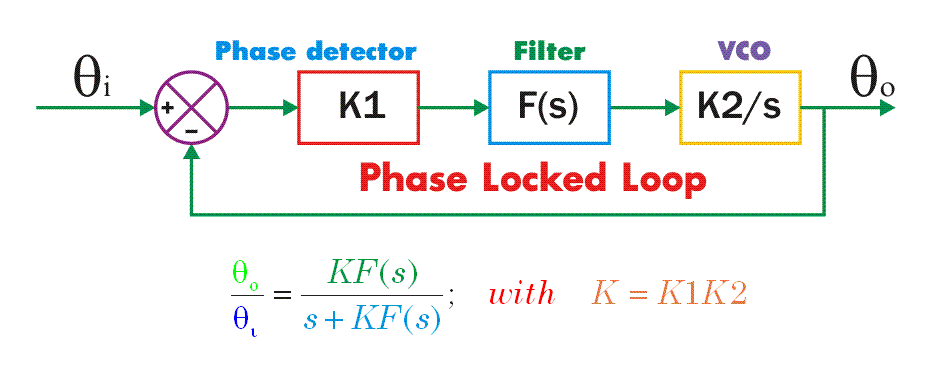
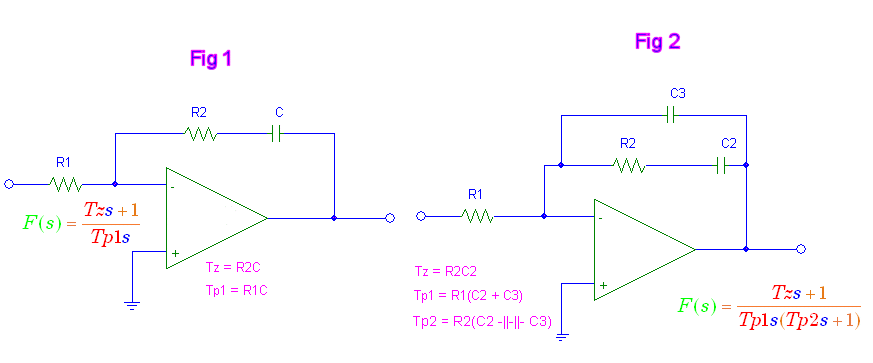
There are very limited restrictions on Tz, Tp1 and Tp2 in the applet and CAUTION is required when using high values of Tz and low values of Tp1 and Tp2. These should be related to physically realistic values. Tp2 must be less than Tz.
Fn = 62 shows the frequency response of the filters.
Fn = 63 to 66 show special cases of Fn = 62.
Some of the properties of loops which use the filter of Fig 1 are shown by Fn = 1 to 30.
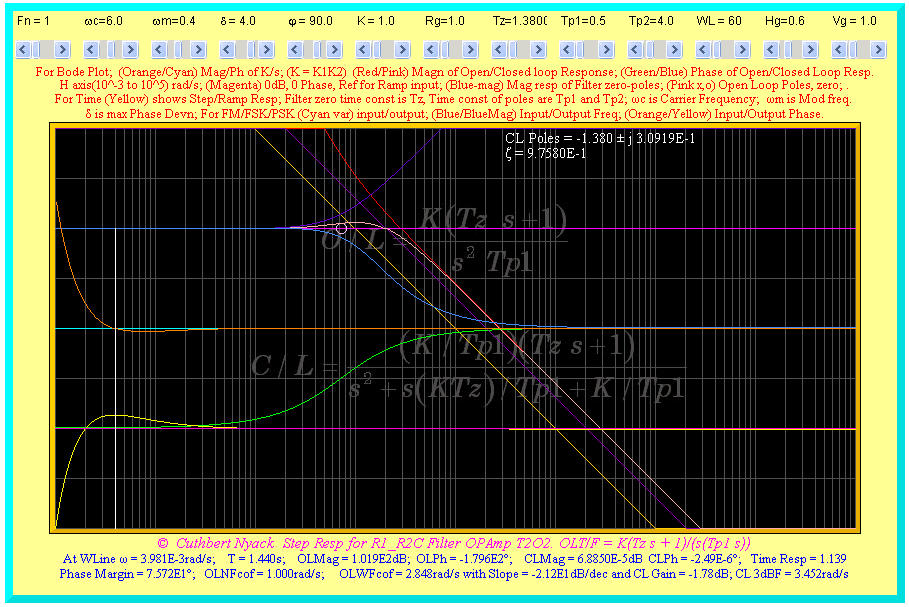
Fn = 1 shows the phase step, frequency impulse response.
Fn = 2 to 5 show special cases of Fn = 1.
Image below shows a case of Fn = 1, Transient Phase response is in yellow and frequency response is in dark orange. In this case Tp1 changes both the risetime and the damping and Tz can be used to damp out the transient oscillations.
Fn = 6 shows the transient behaviour, Bode plot and Root Locus plot. Fn = 7 to 12 show special cases of Fn = 6.
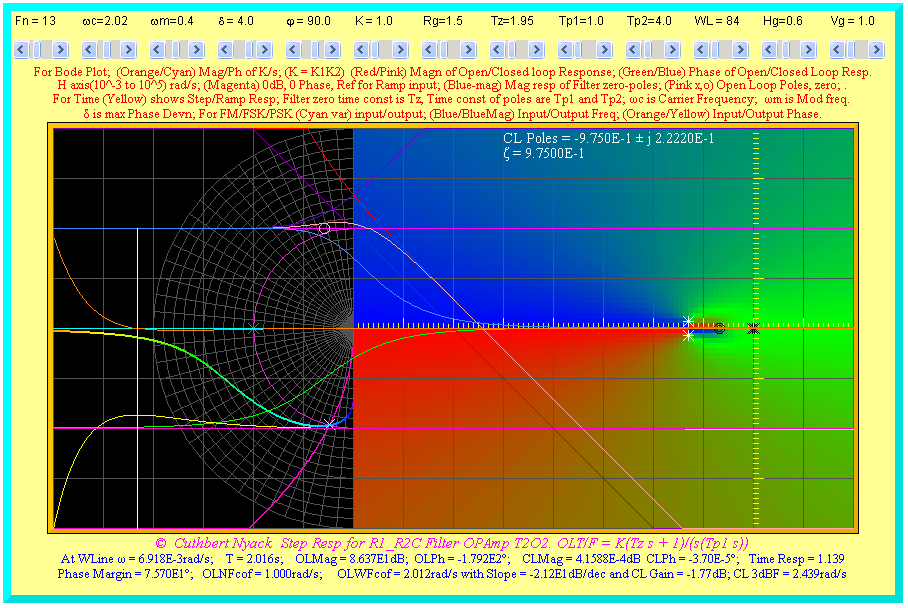
Fn = 13 shows the Bode plot, Nyquist plot, Root Locus and transient behaviour.
Fn = 14 and 15 show special cases of Fn = 13.
A example of Fn = 13 is shown in the image below.
Fn = 16 shows the ramp response for this system.
Fn = 17 and 18 are special cases of Fn = 16. An example of the ramp response for this system is shown in the image below.
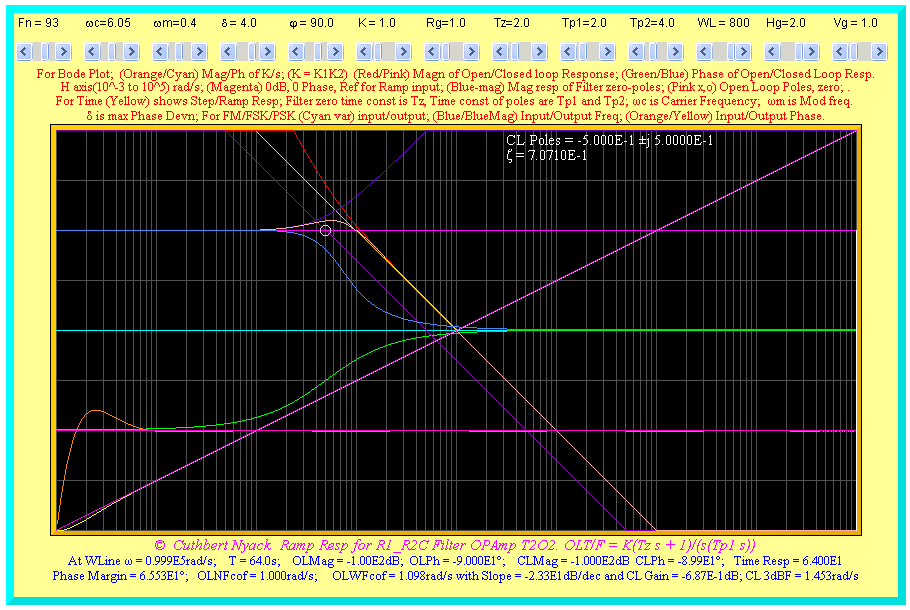
Since this is a Type 2 system, then the phase error to a ramp input is zero. In the first blue line we see that at t = 64, the input is 64 and the response is also 64.
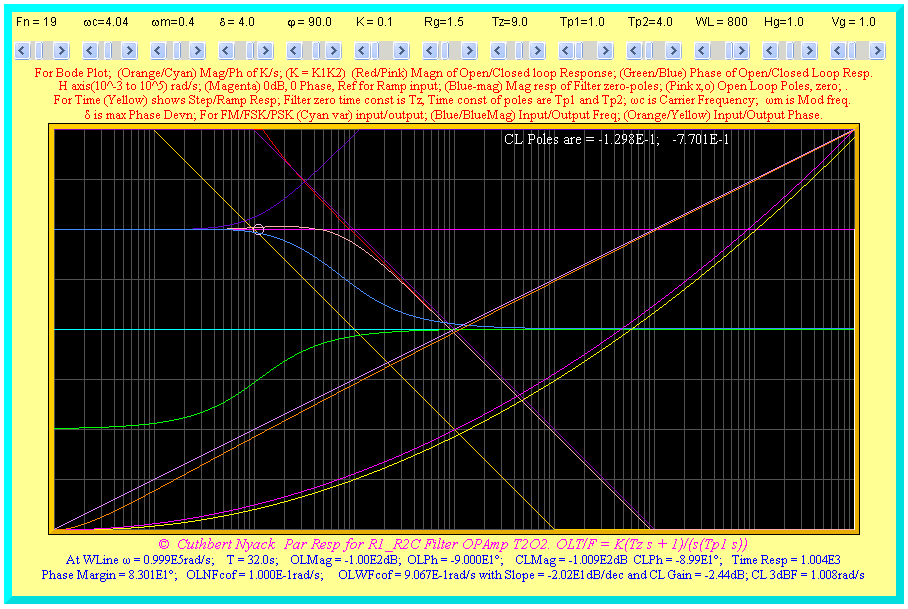
Fn = 19 shows a parabolic phase input.
Fn = 20 and 21 show special cases of Fn = 19.
An example of the parabolic response is shown in the image below. The phase parabolic error which is the difference between the magenta and yellow lines is constant in time while the frequency ramp error tends to zero.
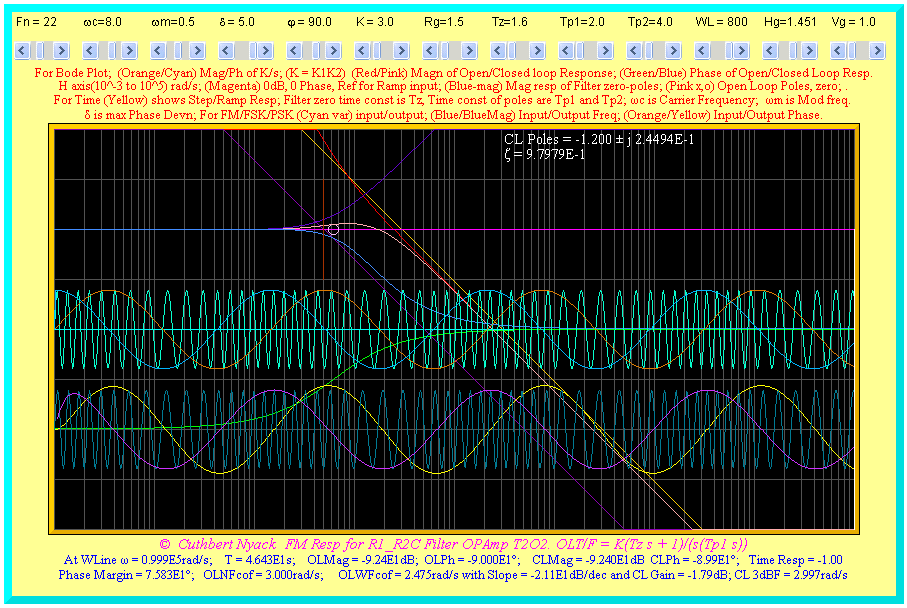
Fn = 22 shows the FM response.
Fn = 23 and 24 show special cases of Fn = 22.
Fn = 25 shows the FSK response with 2 frequencies.
Fn = 26 and 27 show special cases of Fn = 25.
Fn = 28 shows the PSK response with 2 phases.
Fn = 29 and 30 show special cases of Fn = 28.
Note that the PSK response contains a frequency impulse everytime the phase changes.
Image below show a case of the FM response.
Fn = 31 to 61 show the corresponding cases for the Filter of Fig 3. Since this is an active filter, it can increase the 3dB bandwidth and reduce the risetime as shown below.
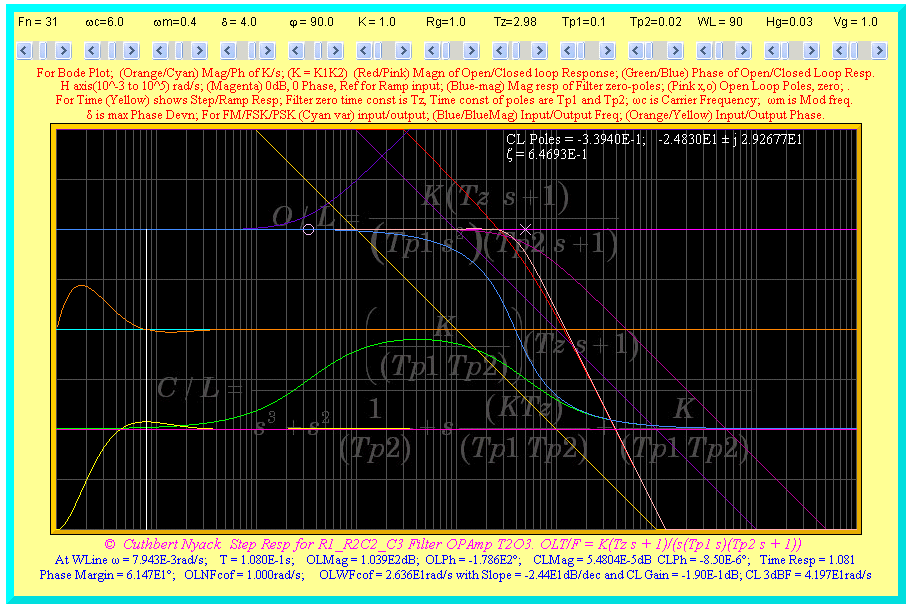
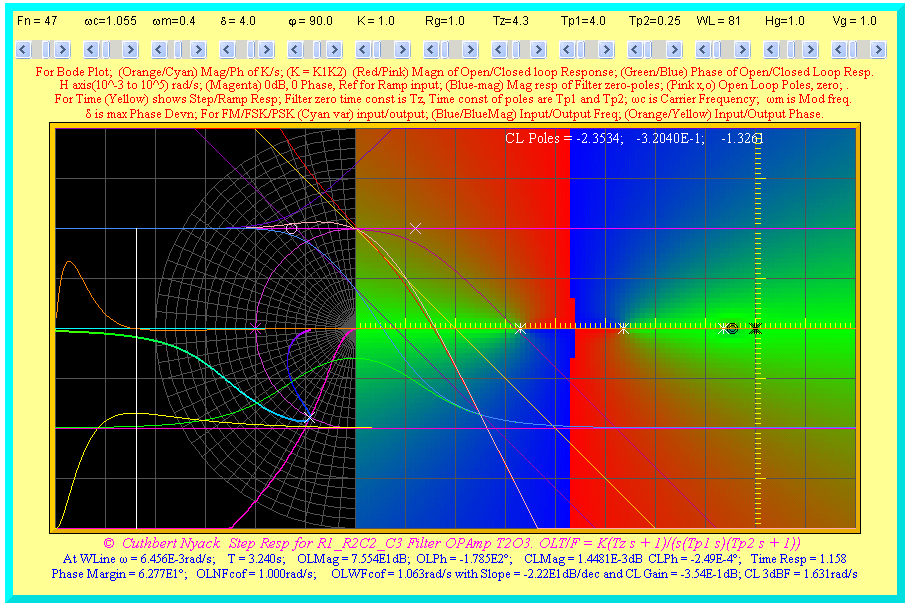
An example showing the Nyquist plot is shown below. The compressed version of the Nyquist plot is convenient for adjusting the frequency response so the minimum phase delay occurs at the crossover frequency.
Fn = 62 shows the frequency response of the filters.
Fn = 63 to 66 show special cases of Fn = 62.
Applet should appear below.
Return to main page
Return to page index
COPYRIGHT © 2012 Cuthbert Nyack.
No hay comentarios:
Publicar un comentario