Learn Python for Data Science: Using Python Libraries in Data Science
Python is one of the most, if not the most,
popular language for big data and data science. Read on to learn why and
how to use Python to work with data.
Join the DZone community and get the full member experience.
Join For Free
Join For Free
The open source HPCC Systems platform is a proven, easy to use solution for managing data at scale. Visit our Easy Guide to learn more about this completely free platform, test drive some code in the online Playground, and get started today.
Python for Data Science is a must learn
for professionals in the Data Analytics domain. With the growth in the
IT industry, there is a booming demand for skilled Data Scientists and
Python has evolved as the most preferred programming language. Through
this blog, you will learn the basics, how to analyze data, and then
create some beautiful visualizations using Python.
This post on "Python for Data Science" includes the following topics:
Python was created by Guido Van Rossum in 1989. It is an interpreted language with dynamic semantics. It is free to access and run on all platforms. Python is: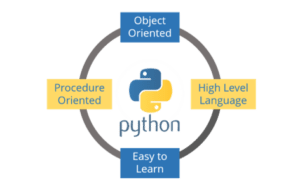
Step 1: Go to the link: https://jupyter.org/
Step 2: You can either click on "Try in your browser" or "Install the Notebook."
I would recommend you to install Python and Jupyter using the Anaconda distribution. Once you have installed Jupyter, you can open it on your default browser by typing "Jupyter Notebook" in the command prompt. Let's now perform a basic program on Jupyter.
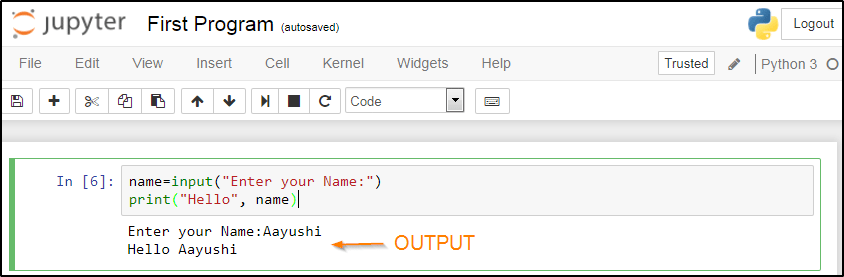
Now, to run this, press "Shift+Enter" and view the output. Refer to the below screenshot:
Now to use the
Next, let us perform data manipulation.
And, finally, let us perform some visualization in Python. Refer to the below code:
This post on "Python for Data Science" includes the following topics:
- Why learn Python for Data Science?
- Python Introduction
- Jupyter Installation for Python with Data Science
- Python Basics
- Python Libraries for Data Science
- Demo: Practical Implementation
Why Learn Python for Data Science?
Python is no-doubt the best-suited language for a data scientist. I have listed down a few points which will help you understand why people go with Python for Data Science:- Python is a free, flexible, and powerful open source language.
- Python cuts development time in half with its simple and easy to read syntax.
- With Python, you can perform data manipulation, analysis, and visualization.
- Python provides powerful libraries for machine learning applications and other scientific computations.
Python was created by Guido Van Rossum in 1989. It is an interpreted language with dynamic semantics. It is free to access and run on all platforms. Python is:
- Object Oriented
- A High-Level Language
- Easy to Learn
- Procedure-Oriented
Jupyter Installation for Python With Data Science
Let me guide you through the process of installing Jupyter on your system. Just follow the below steps:Step 1: Go to the link: https://jupyter.org/
Step 2: You can either click on "Try in your browser" or "Install the Notebook."
I would recommend you to install Python and Jupyter using the Anaconda distribution. Once you have installed Jupyter, you can open it on your default browser by typing "Jupyter Notebook" in the command prompt. Let's now perform a basic program on Jupyter.
name=input("Enter your Name:")
print("Hello", name)
Basics of Python for Data Science
Now is the time when you get your hands dirty in programming. But for that, you should have a basic understanding of the following topics:- Variables: The term 'variables' refers to reserved memory locations to store the values. In Python, you don’t need to declare variables before using them or even declare their type.
- Data Types: Python supports numerous data types, which defines the operations possible on the variables and the storage method. The list of data types includes – Numeric, Lists, Strings, tuples, Sets, and Dictionary.
- Operators: Operators helps to manipulate the value of operands. The list of operators in Python includes: Arithmetic, Comparison, Assignment, Logical, Bitwise, Membership, and Identity.
- Conditional Statements: Conditional statements helps to execute a set of statements based on a condition. There are namely three conditional statements – If, Elif, and Else.
- Loops: Loops are used to iterate through small pieces of code. There are three types of loops, namely, while, for, and nested loops.
- Functions: Functions are used to divide your code into useful blocks, allowing you to order the code, make it more readable, reuse it, and save some time.
Python Libraries for Data Science
This is the part where the actual power of Python with data science comes into the picture. Python comes with numerous libraries for scientific computing, analysis, visualization, etc. Some of them are listed below:- NumPy - NumPy is a core library of Python for Data Science which stands for 'Numerical Python.' It is used for scientific computing, which contains a powerful n-dimensional array object and provides tools for integrating C, C++, etc. It can also be used as a multi-dimensional container for generic data where you can perform various NumPy Operations and special functions.
- Matplotlib - Matplotlib is a powerful library for visualization in Python. It can be used in Python scripts, shell, web application servers, and other GUI toolkits. You can use different types of plots and see how multiple plots work using Matplotlib.
- Scikit-learn - Scikit-learn is one of the main attractions, wherein you can implement machine learning using Python. It is a free library which contains simple and efficient tools for data analysis and mining purposes. You can implement various algorithms, such as logistic regression, using scikit-learn.
- Seaborn - Seaborn is a statistical plotting library in Python. So whenever you're using Python for data science, you will be using matplotlib (for 2D visualizations) and Seaborn, which has its beautiful default styles and a high-level interface to draw statistical graphics.
- Pandas - Pandas is an important library in Python for Data Science. It is used for data manipulation and analysis. It is well suited for different data such as tabular, ordered, and unordered time series, matrix data, etc. This tutorial video on Pandas and data analysis before proceeding.
Demo: Practical Implementation
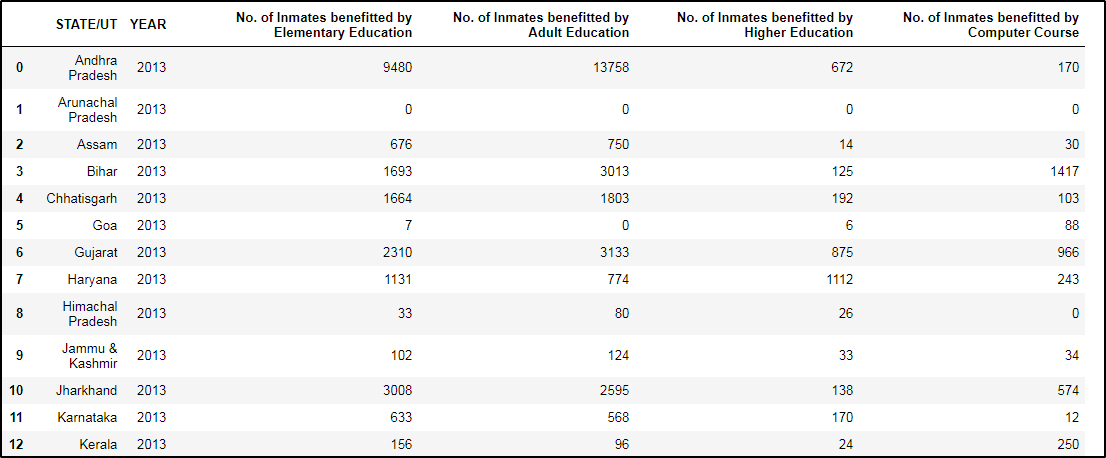
Problem Statement: You are given a dataset which comprises of comprehensive statistics on a range of aspects like distribution and nature of prison institutions, overcrowding in prisons, type of prison inmates, etc. You have to use this dataset to perform descriptive statistics and derive useful insights out of the data. Below are a few tasks:- Data loading: Load a dataset "prisoners.csv" using
Pandas and display the first and last five rows in the dataset. Then
find out the number of columns using the
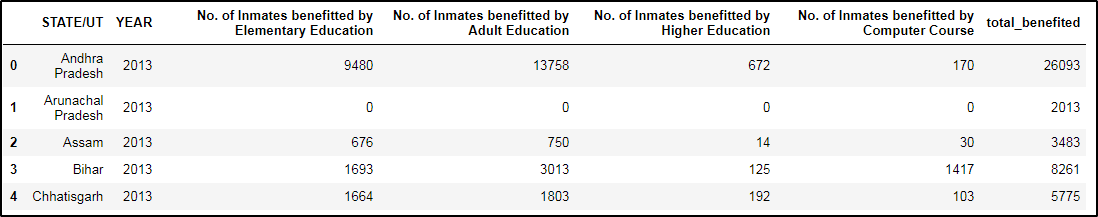
describemethod in Pandas. - Data Manipulation: Create a new column - "total benefitted" - which is the sum of inmates benefitted through all modes.
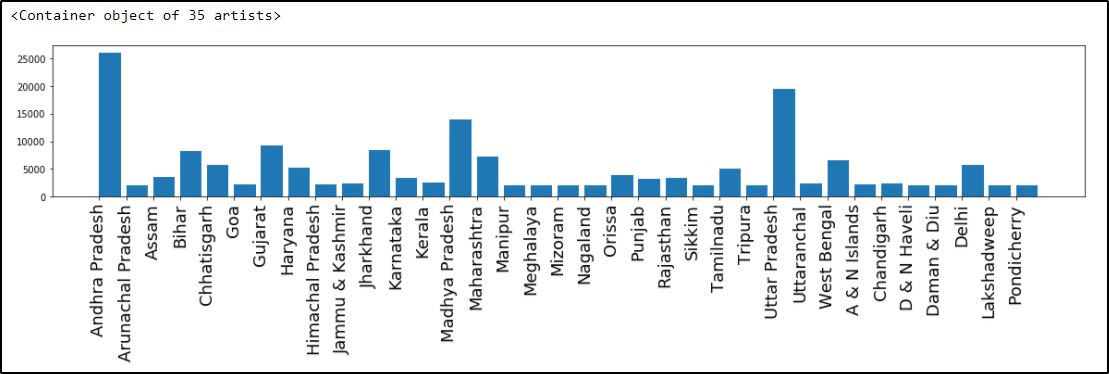
- Data Visualization: Create a bar plot with each state name on the x-axis and their total benefitted inmates as their bar heights.
import pandas as pd
import matplotlib.pyplot as plot
%matplotlib inline
file_name = "prisoners.csv"
prisoners = pd.read_csv(file_name)
prisoners
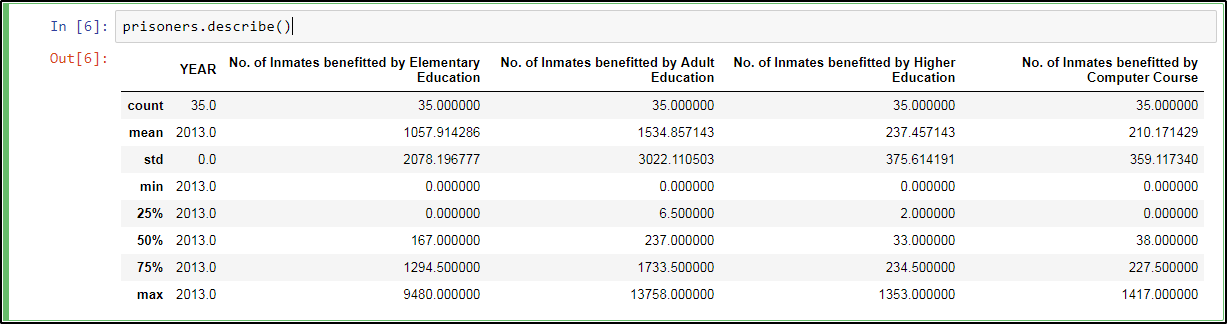
Now to use the
describe method in Pandas, just type the below statement:prisoners.describe()
Next, let us perform data manipulation.
prisoners["total_benefited"]=prisoners.sum(axis=1)
prisoners.head()
And, finally, let us perform some visualization in Python. Refer to the below code:
import numpy as np
xlabels = prisoners['STATE/UT'].values
plot.figure(figsize=(20, 3))
plot.xticks(np.arange(xlabels.shape[0]), xlabels, rotation = 'vertical', fontsize = 18)
plot.xticks
plot.bar(np.arange(prisoners.values.shape[0]),prisoners['total_benefited'],align = 'edge')
Managing data at scale doesn’t have to be hard. Find out how the completely free, open source HPCC Systems platform makes it easier to update, easier to program, easier to integrate data, and easier to manage clusters. Download and get started today.
Your post is very great.I read this post. It’s very helpful. I will definitely go ahead and take advantage of this. You absolutely have wonderful stories. Cheers for sharing with us your blog. For more learning about data science visit at data science course in bangalore
ResponderEliminar