Paradoja de Simpson - Ejemplo sesgo en los que Aplican Posgrados a Universidad de Berkeley, Sex Bias in Berkeley Graduate Admissions?
https://discovery.cs.illinois.edu/learn/Basics-of-Data-Science-with-Python/Simpsons-Paradox/
Simpson's Paradox
In observational studies, you never want to blindly compare everyone in the treatment group to everyone in the control group because…
The treatment and control groups are bound to be different. The goal in experimental design is to have the treatment and control groups as alike as possible. Since observational studies do not involve randomization, the treatment and control groups are often very different from each other.
Confounders can mix up our results. These differences can confound the results and make it look like our treatment is causing the response when it’s actually not.
Sometimes, Simpson’s Paradox can occur.
What is Simpson’s Paradox?
Simpson's Paradox refers to a phenomenon in which a trend appears in different groups of data but disappears or reverses when these groups are combined.
In other words, the overall percentages in two groups (the treatment and control groups) can be misleading because of a confounder. Once the confounder is controlled for by stratification, the overall effect disappears or is reversed.
Simpson’s Paradox is dangerous because the confounder is so extreme that once you control for it by stratifying, the result is reversed. Without stratifying, you will see the opposite results of what is true.
Consider a classic example of Simpson’s Paradox.
Example: Sex Bias in Berkeley Graduate Admissions?
In the Fall of 1973, the University of California at Berkeley released data about their graduate class. The data showed the major the applicant applied to, their self-reported gender (Male or Female), and whether or not they were accepted or rejected:
import pandas as pd
df = pd.read_csv("https://waf.cs.illinois.edu/discovery/berkeley.csv")
df| Year | Major | Gender | Admission | |
|---|---|---|---|---|
| 0 | 1973 | C | F | Rejected |
| 1 | 1973 | B | M | Accepted |
| 2 | 1973 | Other | F | Accepted |
| 3 | 1973 | Other | M | Accepted |
| 4 | 1973 | Other | M | Rejected |
| ... | ... | ... | ... | ... |
| 12758 | 1973 | Other | M | Accepted |
| 12759 | 1973 | D | M | Accepted |
| 12760 | 1973 | Other | F | Rejected |
| 12761 | 1973 | Other | M | Rejected |
| 12762 | 1973 | Other | M | Accepted |
The full Berkeley 1973 Admissions dataset stored in a DataFrame (12,763 rows).
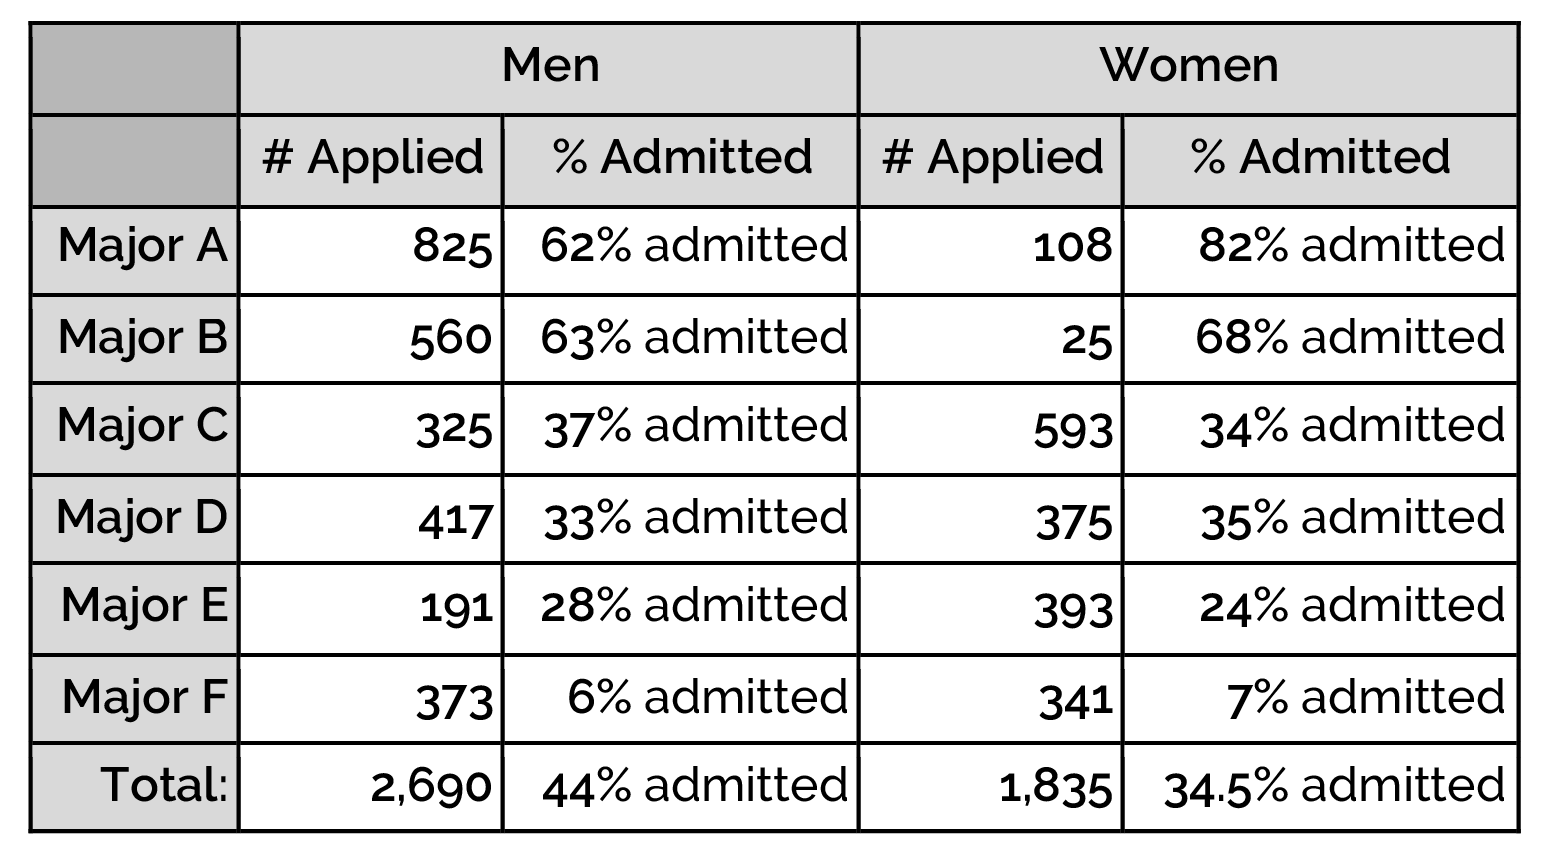
If we look at the overall results, we see that there’s a significant difference in the acceptance rates for males and females. 44% of the men were admitted and only 34.5% of the women were admitted.
Analysis: Was Berkeley Biased?
This was cause for immediate concern! People thought that Berkeley was biased against women. However, we have to remember that this was an observational study and that observational studies could have confounders. The data for what major each applicant applied to was given. Major could be a confounder so the researchers stratified based on major.
Analysis of the graduate admissions at UC-Berkeley in 1973
We can see that when we stratify based on major, the “bias” goes away. Most individual majors favored women or had very similar acceptance rates.
Discussion: What happened?
That semester, more men applied to the “easier to get into” majors. These were majors A and B. They both had an acceptance rate over 50%. That same semester, more women applied to the “harder to get into” majors. These were majors C-F. They had much lower acceptance rates, all below 50%. Berkeley wasn’t biased, instead, Simpson’s Paradox was occurring!
The confounding variable (major) was so extreme that it showed the opposite of what is true. Once we stratified, we were able to compare women who applied to Major A and men who applied to Major A, women who applied to Major B to men who applied to Major B, etc. These were better comparisons!
This is a classic example that shows that in observational studies, looking at overall percentages can be misleading.
Example Walk-Throughs with Worksheets
Video 1: Simpson's Paradox
Practice Questions
Q1: If you want to go to Champaign or Urbana, which bus company should you take to have a better chance of being on time?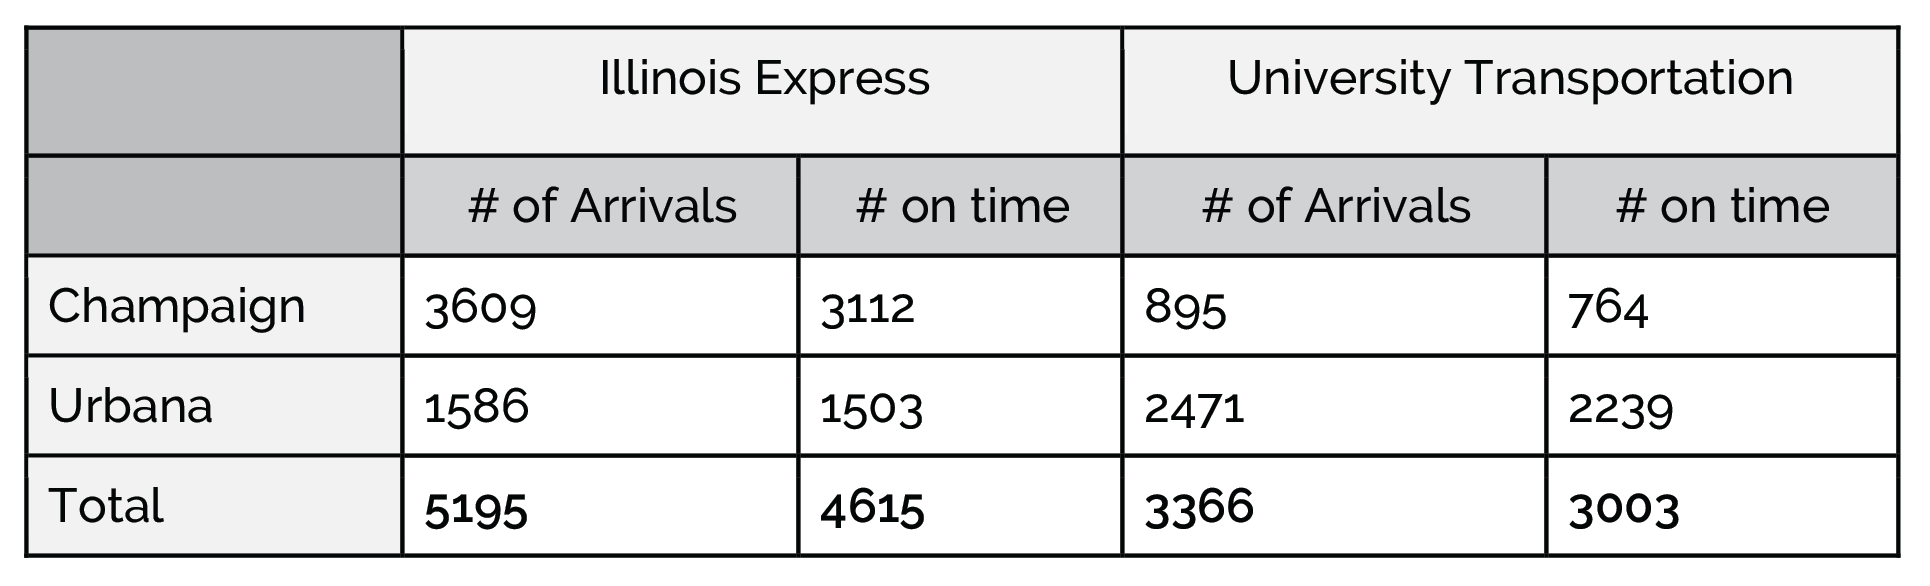
Q2: How is it possible that Illinois Express has a better on-time arrival rate in both destinations but worse overall?
Q3: Which bus company had a better on-time average to Champaign?
Q4: Which bus company had a better on-time average when you combine the two destinations?
Q5: Which bus company had a better on-time average to Urbana?
Q6: Simpson’s paradox is defined as:

No hay comentarios:
Publicar un comentario